PHOENIX-2: A New Broadband Spectrometer for Decimetric and
Microwave Radio Bursts
Acoustic Spectrum Representation
Peter Messmer, Arnold O. Benz, and Christian Monstein
Institute of Astronomy, ETH, CH-8092 Zürich, Switzerland
(C) Copyright 1999, Kluwer Academic Publishers
1. Introduction
A broad-band radio spectrometer measures radio flux density as a function of
observing frequency and time (see printed version of the article in this volume).
This data should be represented in such a way,
that emission patterns, both in frequency and time as well as their dynamics,
can be detected and analyzed.
The common displaying method plots the color coded flux in a frequency-time
plane. Examples of such dynamic spectra are given in Sect. 3 on the left
hand side and in the printed article in this volume.
This representation is well adapted to the localization and feature detection
capabilities of the human visual system.
Here we present an acoustic rendering, exploiting the frequency analysis
features of hearing. Although most people do not have the absolute pitch,
they still can distinguish tones relatively, telling which note is higher or lower.
Beside frequency resolution, differences in loudness are distinguishable,
though merely on a logarithmic scale. The acoustic representation may therefore
be a tool to detect the dynamics of radiation patterns.
The above stated deficiencies of hearing prevent the acoustic representation from being
an exploratory scientific tool. Nevertheless it might be a supplement in a
pedagogical context, where different views of the same phenomenon can deepen
the understanding more then accurate numbers.
This document is organized in the following way:
First the processing method is described in Sect. 2.
Sect. 3 gives some examples of pictorially and acoustically represented dynamic
radio spectra, most of them obtained with the new broad-band spectrometer Phoenix-2.
Conclusions are given in Sect. 4.
2. Acoustic Representation
In case of a frequency-agile radio spectrometer, neither frequency nor time are
continuous variables. The frequency domain is discretisized into frequency channels
with certain bandwidths. Temporal discretization is given by the integration time
in each frequency channel.
One way to build the acoustic representation of a dynamic spectrum starts with
its pictorial representation. Like the staff's line, the horizontal frequency
channels define the pitch of each note. Its loudness is given by the color,
representing the received spectral radio flux density. The temporal discretization
given by the instrumental time resolution leads to a natural length for each note.
The pictorial representation offers a certain degree of freedom in choosing an
appropriate mapping between flux density and color. In case of acoustic
representation, this degree of freedom is given by the mapping between frequency
channel and pitch. Two different mappings were applied here: the proportional
frequency mapping and the tempered chromatic mapping.
The proportional frequency mapping uses the central frequency of the observing
frequency-channel in MHz as the frequency of the corresponding note in Hz. The
tempered pentatonic mapping sets the frequency of each note corresponding to
f = 440 * 2^(2*(z-n)/12), where z is the number of the frequency channel and n
is an offset number. In that case, frequency channel n is mapped to A.
3. Sample Spectra
This section gives some samples of pictorial and acoustic represented dynamic spectra.
Most of them were recorded with the new broad-band radio spectrometer Phoenix-2
of the Radio Astronomy and Plasma Physics
Group at ETH Zürich.
The spectrograms at the left show the channels with radio frequency increasing upward.
This representation is inverted from the usual (including the article in this volume)
because it was found to fit better human perception. It also agrees with musical
notation, where lower pitch is drawn in lower positions.
For coherent solar radio bursts emitted on characteristic frequencies of the local
plasma frequency, this representation means that structures moving downward
in frequency and in the spectrogram propagate to higher altitude in the solar
corona.
NOTE: If your computer understands .WAV-files (most PCs with audio device),
the sound samples can be played by clicking on the speaker icon.
Macintosh users may convert these files with one of the freely available
conversion tools (e.g. SoundApp).
Clicking on the pictures on the left gives a larger view of the spectrograms.

|
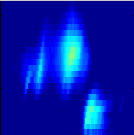
Patches drifting to higher frequencies are clearly audible. They indicate radio
sources moving to higher density and thus presumably downward in the solar
corona.
The spectrum was recorded on 1998/09/23, 06:53:50 - 06:55:00 UT between
1000-1900 MHz, with 2.5 ms total integration time per pixel.
A threshold at 122 sfu above background is subtracted. The frequency
mapping is tempered pentatonic and the note duration is 0.1 s.
|

|
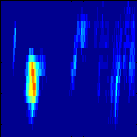
Clearly audible reverse drifting type III-like
structures, especially in the second part of the sample. Such bursts are
interpreted by electron beams accelerated in the corona and moving
toward lower altitudes.
This is an example, where the acoustic representation reveals the structures more
clearly than the pictorial representation. The second, upward drifting burst
is more difficult to hear due to the large number of concurrent intense channels.
The spectrum was recorded on 1998/11/23, 10:56:47 - 10:57:44 UT
between 1140-2280 MHz, with 8 ms total integration time per pixel.
A threshold at 54 sfu above background is subtracted.
The frequency mapping is tempered pentatonic and the note duration
is 0.1 s.
|

a) 0.1s / note
|

b) 0.3s / note
|
|
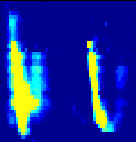
The spectrum shows two Type U bursts, caused by electron beams
following a loop-like magnetic field, first up and then down (remember the
inverted spectrogram representation in this document). Between the two
U bursts, a faint, drifting structure can be heard.
The spectrum was recorded on 1998/09/11, 16:01:27 - 16:01:33 UT
between 579-1020 MHz, with 8 ms total integration time per pixel.
A threshold at 25 sfu above background is subtracted. The frequency
mapping is tempered pentatonic and the note duration is
a) 0.1 s and b) 0.3 s.
|

a) Pentatonic
|

b) Proportional
|
|
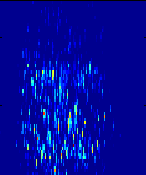
The short time scales and the random frequency distribution of
narrowband decimetric Spikes can be heard. Their
origin is not known. Their appearance is usually accompanied by strong
particle acceleration.
The spectrum was recorded with Phoenix(-I) on 1990/12/25, 09:37:05 - 09:37:17 UT ,
between 1000-1756 MHz, with a total integration time of 2.5 ms per pixel.
A threshold at 2 sfu above background was subtracted. Both a) tempered
pentatonic and b) proportional frequency mapping are provided, the note
duration is 0.1 s.
|

a) Pentatonic
|

b) Proportional
|
|
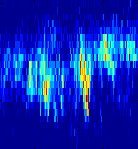
The short duration and the random frequency distribution of
narrowband decimetric Spikes are clearly audible.
The spectrum was recorded on 1998/10/13, 09:37:05 - 09:37:09 UT,
between 1000-1756 MHz, with a total integration time of 2.5 ms per pixel.
A threshold at 2 sfu above background was subtracted.
Both a) tempered pentatonic
and b) proportional frequency mapping are available, the note duration is 0.1 s.
|
4. Conclusion
An acoustic representation of dynamic radio spectra is presented. The method is less of
scientific significance than of pedagogic and aesthetic interest. Some dynamic aspects
of the radio data can be heard more easily than seen in the pictorial representation.
On the other hand, broad-band emissions are likely to cause indistinguishable noise,
drowning finer structures.